THE SHORT ANSWER
The key idea, first.
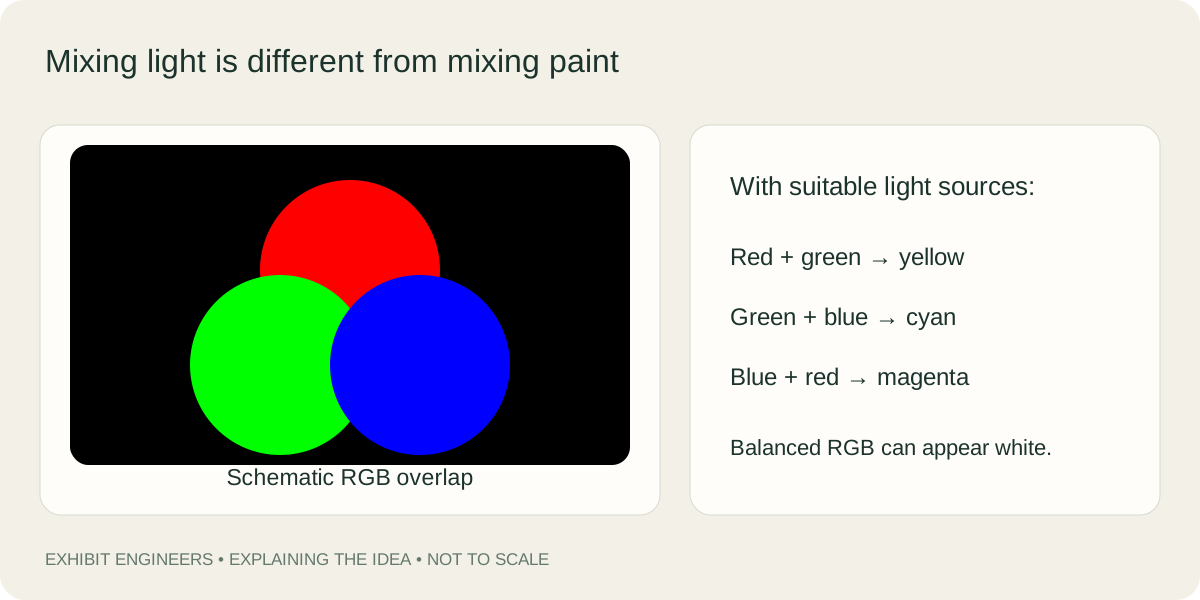
Additive color mixing combines light reaching the eye. Suitable RGB pairs can look yellow, magenta or cyan; balanced red, green and blue can appear white. Paints and filters selectively remove incident light, so their mixing follows a different process.
- Distinguish adding light from selectively absorbing it.
- Predict pairwise RGB overlaps and explain a colored shadow through missing illumination.
- Separate an observed lighting response from evidence about calibrated RGB outputs.
WATCH & NOTICE
Look closely at the demonstration.
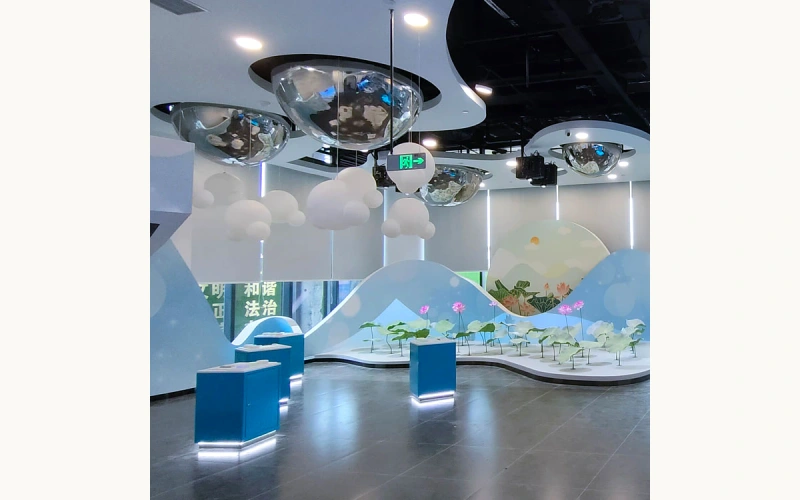
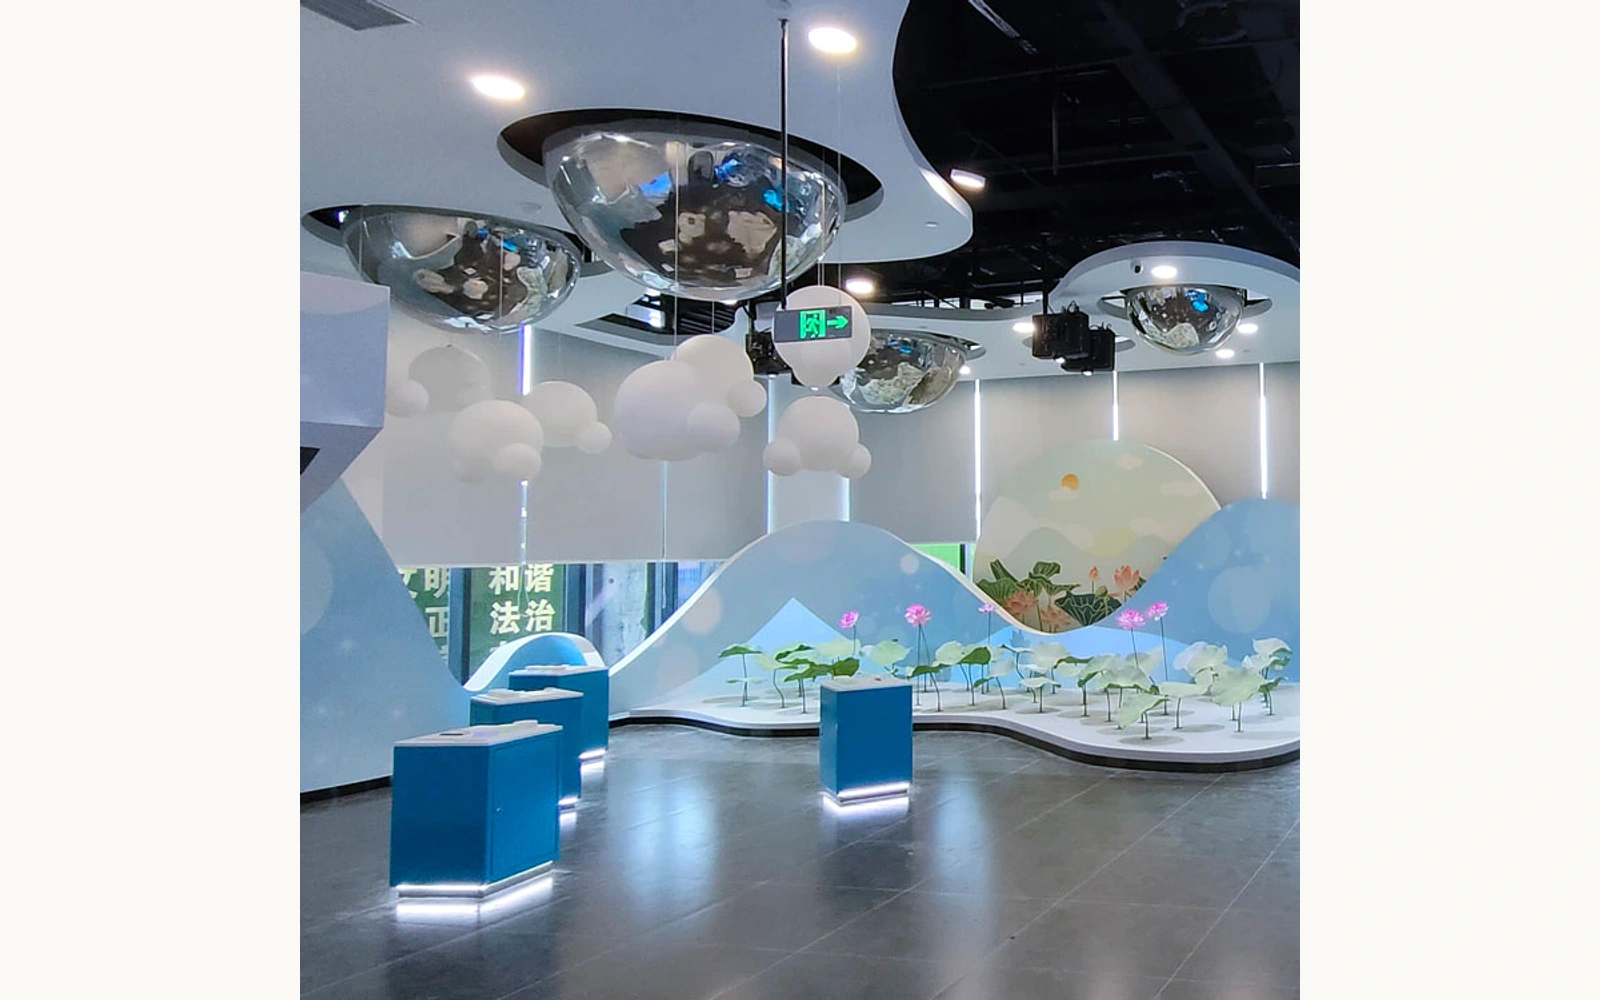
The physical video shows visitor stations and suspended molecular light forms. Compare the visitor's action with the changing illumination.
Locate the input
Find the palette station and observe the visitor's action.
Compare responses
Compare the suspended forms' apparent colors without assigning numerical RGB values.
Ask what is missing
Can red, green and blue contributions be isolated? If not, note that the mixing process is not directly visible.
About this video reference
This footage demonstrates a physical color-response activity, not calibrated primary spectra or a verified RGB control algorithm. Camera settings and viewing conditions are not measured. The related Light Island footage shows red light paths and optical elements, not an RGB overlap experiment.
01 / EXPLAINING THE IDEA
Ask what light reaches the eye
Place red, green and blue light spots on a white screen so their illuminated areas overlap. Where more than one source reaches the same patch, the outgoing light includes contributions from those sources. The University of Arizona's optics-outreach activity uses this arrangement to introduce additive mixing. Appropriate relative contributions from all three primaries can produce an appearance of white.[1]
The word additive describes combining illumination. A screen's RGB elements use the same general principle to produce a broad range of apparent colors, although a specific display has its own capabilities. An RGB diagram is therefore a model of contributions from selected primaries. It is not a claim that three arbitrary lamps reproduce every color visible to a person.[1]
02 / EXPLAINING THE IDEA
Use the overlaps to predict a colored shadow
With suitable RGB lights, each pair can produce a familiar secondary appearance. Red with green can look yellow, red with blue magenta, and green with blue cyan. Relative strengths matter: the table describes useful target mixtures, not a guarantee for every lamp or viewing condition. Look at both an overlap and the neighboring single-source patches.[2]
Now put an opaque object between the lamps and screen. It can block one lamp's contribution while light from the others still reaches that patch. A region missing red can therefore appear cyan. A colored shadow does not mean the object creates colored light; it reveals which illumination remains. The Exploratorium's colored-shadows activity makes this comparison directly.[2]
| Light reaching the patch | Target appearance |
|---|---|
| Red + green | Yellow |
| Red + blue | Magenta |
| Green + blue | Cyan |
| Balanced red + green + blue | White |
03 / EXPLAINING THE IDEA
Paint changes the light that survives
A pigment does not need to emit its own light to appear colored. It absorbs some parts of the incident light and leaves others available for reflection. Adding pigments can remove more of that illumination. This is the basis of subtractive mixing, discussed in Konica Minolta's colorimetry guide. It explains why combining red and green paint does not follow the same rule as overlapping red and green beams.[3]
Filters offer another useful contrast: they selectively transmit light rather than simply add a new source. Always identify whether an activity combines beams, passes light through filters, or mixes material pigments. Calling every colored object a primary color hides these differences. For real paints, scattering, pigment properties and the illuminating light also matter, so a simple three-color chart does not predict every mixture exactly.[3]
04 / EXPLAINING THE IDEA
Turn the color chart into a testable question
Before a teacher-led lamp demonstration, give learners a blank three-circle sketch. Predict each overlap and describe the expected contributions. Compare the drawings with the screen, recording differences between prediction and observation. Keep the first drawing so the group can explain which idea changed.
Choose a small follow-up question: what changes when one source is covered while the other two remain in place? Label the source positions so the group can explain the resulting patches. Compare the test with the earlier diagram and write the missing contribution beside each shadow. These records make the explanation inspectable even if observers choose slightly different everyday names for a hue.
05 / EXPLAINING THE IDEA
Read the museum media within its actual scope
The featured molecular-light installation provides a physical context for a color activity: a visitor works at a palette station while suspended forms show different colors. The video makes the response visible but does not isolate each light source or disclose the software calculation. It can introduce a question about color control; it cannot establish how particular RGB intensities were combined.
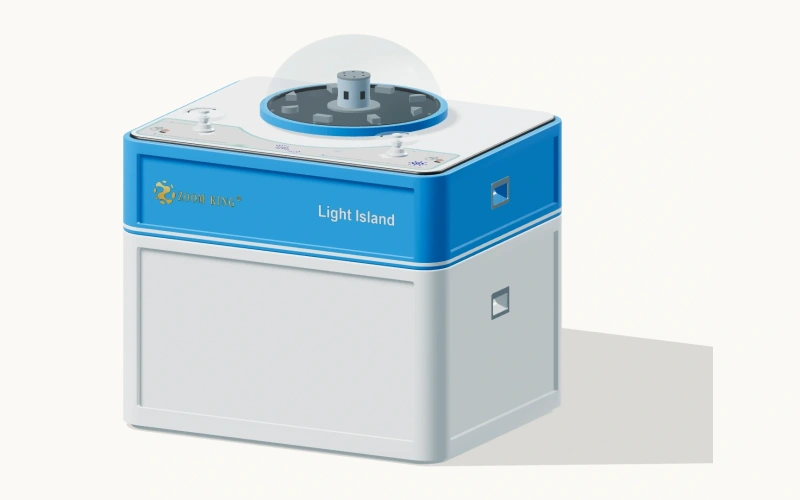
The related Light Island physical recording serves a different purpose. The video shows red paths meeting optical elements as a hand operates a rotary control. That is useful for discussing how to trace an optical path. The evidence does not show three colored beams making white. Product records can support related learning routes while preserving the distinction between ray-path demonstrations and additive mixing.
06 / EXPLAINING THE IDEA
Make a claim that another observer could check
Ask pairs to identify the strongest video-supported claim. 'The form appears purple here' describes appearance. 'The controller sent these RGB values' describes an internal process. List the additional evidence needed for that second statement, such as documented controls and measured output.
Compare the prediction sketch, classroom overlap observation and museum color-response observation. Which directly tests adding beams, and which shows an application or an unresolved mechanism? Link each visible result to its proposed explanation, and mark where the recording cannot supply that link.
Common questions.
Why can red and green light look yellow?
A suitable combination produces a visual response that can appear yellow. Adding beams does not turn their wavelengths into one new yellow wavelength.[2]
Will equal red, green and blue settings always look white?
No. A numerical setting alone does not establish balanced optical output. The sources and viewing conditions matter.[1]
Is mixing colored paint additive?
Paint mixing is generally explained through selective absorption and reflection, so the subtractive model is the appropriate starting point.[3]
SCIENCE & FURTHER READING
Follow the sources.
Read the original scientific explanations and teaching resources behind this article.
- University of Arizona Optics Outreach: Color Mixing
RGB overlap demonstration and display-pixel connection; balanced appearance is not inferred from an uncalibrated video.
- Exploratorium Science Snack: Colored Shadows
Pairwise light mixtures, blocking selected illumination and the perceived-yellow explanation.
- Konica Minolta: Language of Light — Mixing of Colours
Official colorimetry educational reference contrasting addition of colored lights with selective absorption by pigments.
Editorial: Exhibit Engineers science & exhibit team. Scientific references are cited for the explanations; product configuration details follow the linked exhibit records.